Forum Replies Created
-
1 pttav2119March 23, 2017 at 11:38 pm #1038
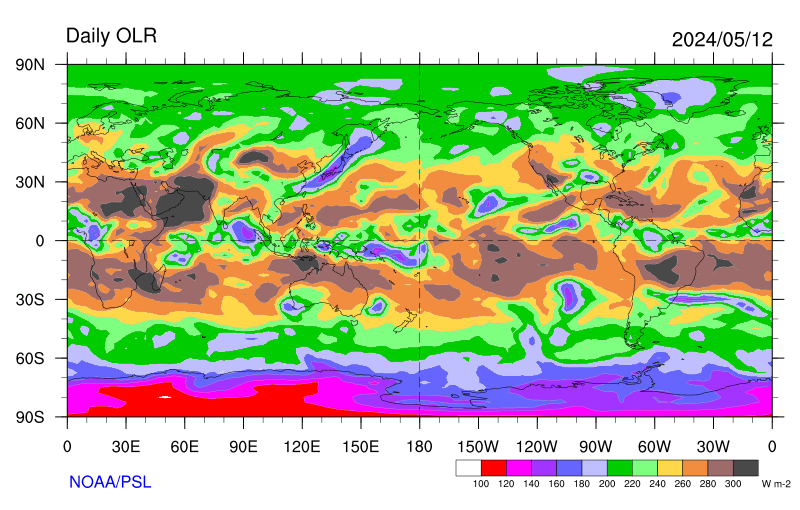
Sorry my bad on the OLR map, I forgot to mention in my post that I generated maps from NOAA’s raw data. Some a prototype of some the tools Ben has mentioned on the morning news. I posted it as am example because we want our tools to as much as possible clearly show if an anomaly is real or just a routine data glitch. Since we all are part of a citizen scientist project, main stream science is going to hold us to a higher standard, so we want you to have world class data and tools. The relevant map from NOAA is posted below.
I can’t give you to many tips on quake forecasting as I don’t do much manual quake forecasting myself. As far as quakes go most of my time is spent on statistics and data product development for your use. With that is mind a couple quick comments. OLR can indeed be useful, there are may papers on micro OLR anomalies as precursor signals. The bad news about this line of research is the lack of publicly available tools. Something we are working to fix. The other way Ben has used OLR is in conjunction with the wind map for looking at the global electric circuit. There are deeper looks on the topic. To much to cover in a forum post, but a quick hint, start looking at areas where anomalies do not seem to move with the weather patterns.
I don’t know about TEC. I think that is an open question. As for F2 layer and ionosphere anomalies you intuition is probably right. There are papers that support earthquake precursor signals. The question would be how useful is the public data since it is geared to radio propagation. Worth a look though.
Good luck with you forecasts.
Tim at 9Rese
Score: 0 1 pttav2119March 23, 2017 at 2:56 am #1035
Hi Stevec64, a couple of comments about OLR missing data. If you are referring to the drop out in ocean west of northern SA this is a normal daily dropout. If one only looks at the daily OLR anomaly chart on Quakewatch this might not be clear because NOAA sets the area covered by the dropout to white, which is the color for no anomaly ( its NOAA after all, go figure). In order to see the normal twice dialy you need to look at the daily regular OLR at NOAA’s map room (https://www.esrl.noaa.gov/psd/map/clim/olr.shtml). A good test if it’s normal daily drop out is to look half way around the world and see if there is a mirror image of the drop. So in this case the drop out is near SA so check out near Malaysia. Sure enough there is a mirror image of the dropout northwest of SA. Also the daily drop out runs in a line more or less north and south.
A run down of how the OLR anomaly map is made. The map uses the NOAA 18 satellite which is in polar orbit. NOAA 18 passes over each point on earth twice a day, one pass in daylight and one pass at night. Two sets of OLR data are create, a night side and a day side OLR. For NOAA’s map room olr the day and night sides are averaged. To produce the anomaly map the average OLR over a number of years is basically subtracted (more complex methods can also be used) from the daily OLR. There are some interesting papers concerning day side vs night side OLR quake precursors.
Tav at 9Rese
 This post has received 1 vote up.Score: 1
 -
|