QuakeWatch.net
EARTHQUAKE PREDICTION CENTER
A free web-resource by Suspicious0bservers.org.
Our Work on Earthquakes:
Davidson, Holloman, U-yen, 2015
Davidson, 2015
–
Davidson, 2017
Davidson and Yelverton, 2017
OTF 2017 Presentation
2018 Model Update and Changes
Davidson, Holloman, U-yen, 2015
Davidson, 2015
–
Davidson, 2017
Davidson and Yelverton, 2017
OTF 2017 Presentation
2018 Model Update and Changes
Earthquake Forecasting & Prediction [Read More]
Blot-Echo WindMap – by 9Rese’
Blot-Echo WindMap – by 9Rese’
The tool below combines the subterranean and atmospheric signals. This map shows Blot echoes (M4+ and >70km deep); the colored areas denote the location of deep earthquakes along subduction areas. Multiple events expand the ‘red-zone’ and colors fade over 72 hours. A pressure-colored wind-map for location of pressure cells is included as well. Wind-map Pressure Legend: red/white = high pressure, blue = low pressure. There are multiple map options and zoom capability.
ABOVE ↑
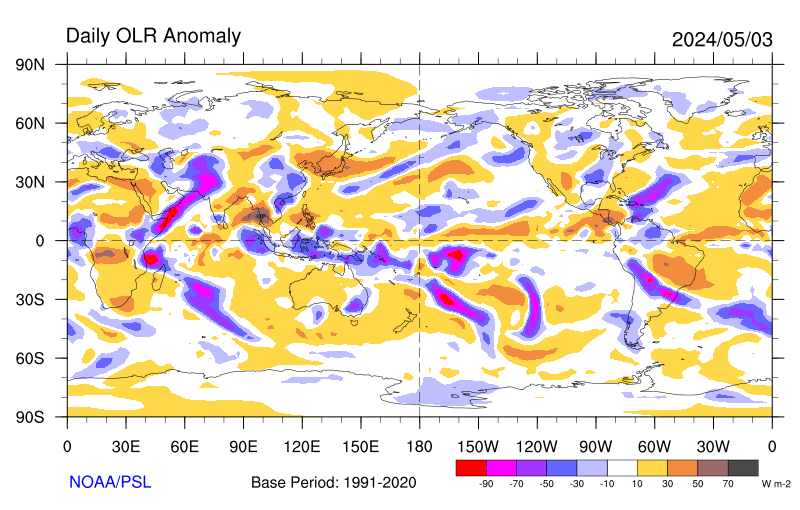
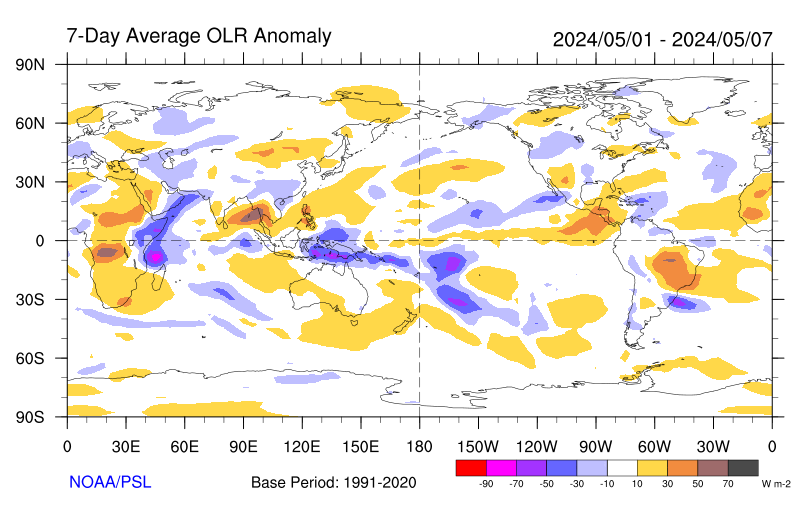
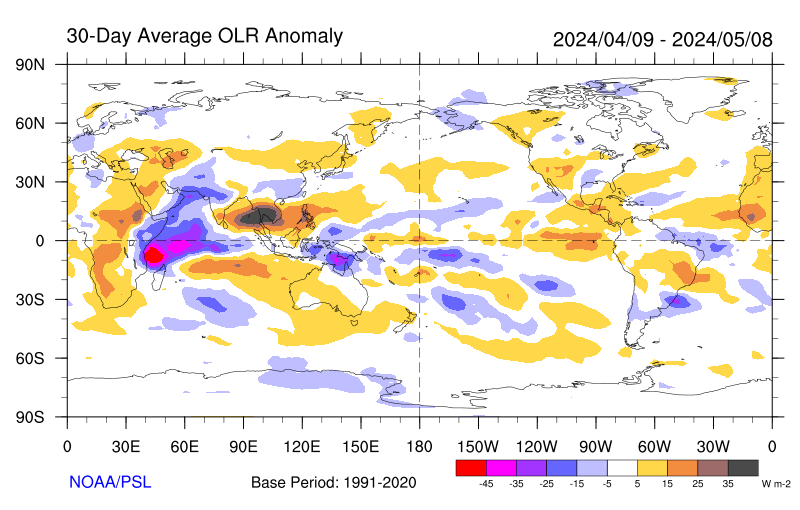
ESRL/NOAA OLR Anomaly Map
Our model seeks “delta class” OLR anomalies, which are similar to delta-class sunspots. A strong anomaly gradient, within 10 degrees (map hash marks), over a fault line, is a strong atmospheric signal. Below, you can find the weekly and monthly anomalies, which tend to favor positive anomalies only.
The Earthquake Prediction Center at QuakeWatch.net is the home of the study of pre-seismic signals, and the practice of earthquake forecasting. The Earthquake Prediction Center at QuakeWatch.net is a division of SpaceWeatherNews and is supported by a collective of more than 400,000 people. The model was formulated by performing a thorough survey and review of the available literature on pre-seismic signals like foreshock patterns, ground ion changes, atmospheric and electromagnetic factors, and the most robust and reliably-available factors were chosen to combine into a real-world-practice model that seeks to use these factors to actively reduce the global active fault area by 80 to 90%, finding the 10 to 15% of of earth most at-risk of a large and significant earthquake at that time (usually M7+). The model has been successfully predicting the location of M7+ earthquakes, within that 10 to 15%, approximately +80% of the time.
Step 1: Locate the Blot Echoes & Low Pressure
Step 2: Find Delta Class OLR Anomalies
Step 3: See Where the Lows are Going
BELOW ↓
The 48hr SDO/AIA 211 solar video shows coronal holes (CHs), the primary earthquake factor. We are looking for the dark patches, which indicate that the interplanetary magnetic fields connecting earth to sun may be about to experience significant fluctuations of energy. Learn more about why coronal holes are important earthquake factors here and in Davidson, 2015.
The Kp index (below) shows the level of geomagnetic activity resulting from space weather. The occurrence of geomagnetic storms (Kp>4) appears to have a depressive effect on earthquakes during the peak of the storms. The primary risk window begins when a mid/low latitude coronal hole reaches the earth-facing 1/4th of heliographic longitudes, and ends when geomagnetic storms occur, or when the coronal hole leaves the earth-facing half of the sun.


